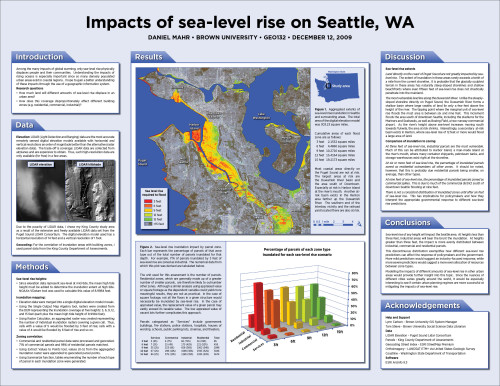
This is a web-formatted version of my final project for GEO132. See above for the poster version.
Introduction
Among the many impacts of global warming, only sea-level rise physically displaces people and their communities. Understanding the impacts of rising oceans is especially important since so many densely populated urban areas exist in coastal regions. I hope to gain a better understanding of these impacts through the use of a geographic information system.
Research questions:
- How much land will different amounts of sea-level rise displace in an urban area?
- How does this coverage disproportionately affect different building zones (e.g. residential, commercial, industrial)?
Data
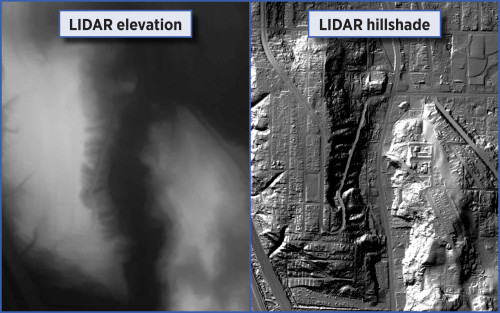
Elevation: LIDAR (Light Detection and Ranging) data are the most accurate remotely sensed digital elevation models available with horizontal and vertical resolutions an order of magnitude better than the alternative (radar elevation data). The trade-off is coverage: LIDAR data are collected from airplanes and are expensive to obtain. Thus, such high-resolution data are only available (for free) in a few areas.

Due to the paucity of LIDAR data, I chose my King County study area as a result of the extensive and freely available LIDAR data set from the Puget Sound LIDAR Consortium. The digital elevation model used has a horizontal resolution of 14 feet and a vertical resolution of 1 foot.
Geocoding: For the correlation of inundation areas with building zones, I used parcel data from the King County Department of Assessments.
Methods
Sea-level rise heights:
- Since elevation data represent sea-level at mid-tide, the mean high tide height must be added to determine the inundation extent at high tide. NOAA’s VDatum tool was used to calculate this value of 8.9984 feet.
Inundation mapping:
- Elevation data were merged into a single digital elevation model mosaic.
- Using the Single Output Map Algebra tool, rasters were created from the DEM representing the inundation coverage at five heights: 3, 6, 9, 12, and 15 feet (each plus the mean high tide height of 8.9984 feet).
- Using Raster Calculator, an aggregated raster was created representing the number of individual inundation rasters covering a given cell. Thus, cells with a value of 5 would be flooded by 3 feet of rise; cells with a value of 4 would be flooded by 6 feet of rise and so on.
Zoning correlation:
- Commercial and residential parcel data were processed and geocoded. 71% of commercial parcels and 98% of residential parcels matched.
- Using Extract Values to Points tool, values (0-5) from the aggregated inundation raster were appended to geocoded parcel points.
- Using Summarize function, tables enumerating the number of each type of parcel in each inundation zone were generated.
Results

The total area of the digital elevation model was 303.23 square miles.
Cumulative areas of each flood zone are as follows:
- 3 feet – 2.1532 square miles
- 6 feet – 4.4860 square miles
- 9 feet – 10.2716 square miles
- 12 feet – 15.4164 square miles
- 15 feet – 19.2173 square miles
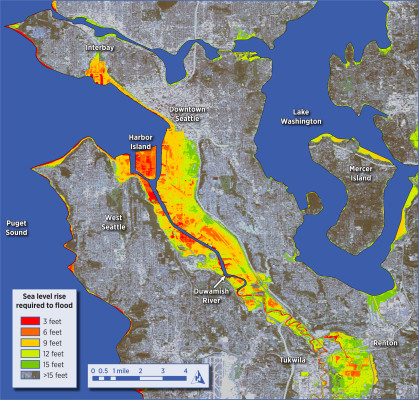
Most coastal areas directly on the Puget Sound are not at risk. The largest areas at risk are the Duwamish River basin and the area south of Downtown. Especially at risk is Harbor Island at the river’s mouth. Another at-risk basin exists in the Renton area farther up the Duwamish River. The southern end of the Interbay vicinity and the railroad yard located there are also at risk.

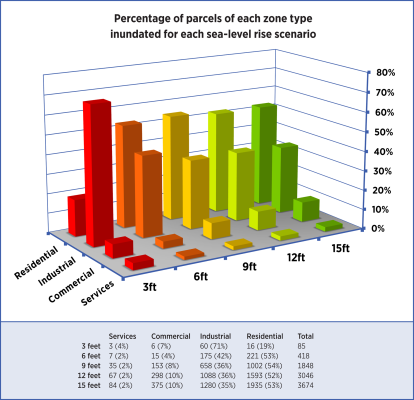
Sea-level rise inundation impact by parcel zone. Each bar represents the percentage of parcels of that zone type out of the total number of parcels inundated for that depth. For example, 71% of parcels inundated by 3 feet of sea-level rise are zoned as industrial. The numerical data from which this plot was derived are tabulated below.
The unit used for this assessment is the number of parcels. Residential zones, which are generally made up of a greater number of smaller parcels, are therefore likely to outnumber other zones. Although a similar analysis using appraised value or square footage as the dependent variable could yield more meaningful results, they are not as practical. In the case of square footage, not all the floors in a given structure would necessarily be inundated by sea-level rise. In the case of appraised value, the replacement value of a given parcel may vastly exceed its taxable value. The low appraised value of vacant lots further complicates this approach.
Parcels categorized as “Services” include government buildings, fire stations, police stations, hospitals, houses of worship, schools, public parking lots, cinemas, and theaters.
Discussion
Sea-level rise extents
Land directly on the coast of Puget Sound are not greatly impacted by sea-level rise. The extent of inundation in these areas rarely exceeds a tenth of a mile from the current shoreline. It is probable that the glacially sculpted terrain in these areas has naturally steep-sloped shorelines and shallow beachfronts where even fifteen feet of sea-level rise does not drastically penetrate into the mainland.
The most vulnerable land lies along the Duwamish River. Unlike the steeply-sloped shoreline directly on Puget Sound, the Duwamish River forms a shallow basin where large swaths of land lie only a few feet above the height of the river. The tipping point where the marginal unit of sea-level rise floods the most area is between six and nine feet. This increment floods the area south of downtown Seattle, including the stadiums for the Mariners and Seahawks, as well as Boeing Field, a two-runway commercial airport. As the river’s height above sea-level increases moving south towards Tukwila, the area at risk shrinks. Interestingly, a secondary at-risk basin exists in Renton, where sea-level rise of 12 feet or more would flood a large area of land.
Comparison of inundation to zoning
At three feet of sea-level rise, industrial parcels are the most vulnerable. Much of this can be attributed to Harbor Island, a man-made island at the river’s mouth, where many container shipyards, petroleum tanks, and storage warehouses exist right at the shoreline.
At six or more feet of sea-level rise, the percentage of inundated parcels zoned as residential outnumbers all other zones. It should be noted, however, that this is probably due residential parcels being smaller, on average, than other types.
At nine feet of sea-level rise, the percentage of inundated parcels zoned as commercial spikes. This is due to much of the commercial district south of downtown Seattle flooding at nine feet.
There is not a consistent distribution of inundated zones until after six feet of sea-level rise. This has implications for policymakers and how they interpret the appropriate governmental response to different sea-level rise predictions.
Conclusions
Sea-level rise of any height will impact the Seattle area. At heights less than three feet, industrial areas will bear the brunt the inundation. At heights greater than three feet, the impact is more evenly distributed between industrial, commercial and residential parcels.
This discontinuous distribution exemplifies how different sea-level rise predictions can affect the response of policymakers and the government. More mild predictions would suggest an industry-focused response, while more severe predictions would suggest a more even allocation of resources between zone types.
Modelling the impacts of different amounts of sea-level rise in other urban areas would provide further insight into this topic. Since the nuances of different cities varies greatly around the world, it would be especially interesting to see if certain urban planning regimes are more successful at mitigating the impacts of sea-level rise.
Acknowledgements
Help and Support
- Lynn Carlson – Brown University GIS System Manager
- Tom Stieve – Brown University Social Science Data Librarian
Data
- LIDAR Elevation – Puget Sound Lidar Consortium
- Parcels – King County Department of Assessments
- Geocoding Street Index – ESRI StreetMap Premium
- Orthoimagery – LANDSAT ETM+ via United States Geologic Survey
- Coastline – Washington State Department of Transportation
Software
- ESRI ArcInfo 9.3

Daniel
I was wondering if I could use your poster at
http://www.flickr.com/photos/dmahr/4177582588
as an example of a well prepared poster? The poster would be printed in documents for science students. You would be credited as the creator of the poster.
Thanks,
Dr. Roy Jensen
Chemistry, Grant MacEwan University
This is good information. Any update on the situation since this report? So looks like the waterfront homes & condos in the Alki area will be mostly gone in the 3 feet rise level. When will we see signs of this happening, in 50 years? We are thinking of retiring in the Alki area so prompt us looking into this subject.
Thanks,
Lin
Request for copyright permission to use your map of Seattle sea level rise. I am working on a book about this and preparing a PowerPoint to summarize the book.
Thanks
Julie
Hi Julie,
Please go ahead and use the poster for your project. Just include an attribution: “Dan Mahr, dmahr.com”
Thanks for getting in touch,
Dan