NASA Earth Observatory Puzzler

I’m big fan of the NASA Earth Observatory website run by the Goddard Space Flight Center. Their Image of the Day series showcases stunning imagery and applications of remote sensing every day, in the style of the long-running Astronomy Picture of the Day. They also hold a monthly “puzzler” competition, where they post a satellite image without any annotations and ask readers to identify the location and why it’s interesting. For the December puzzler, they posted the following image:

NASA Earth Observatory December 2014 puzzler image

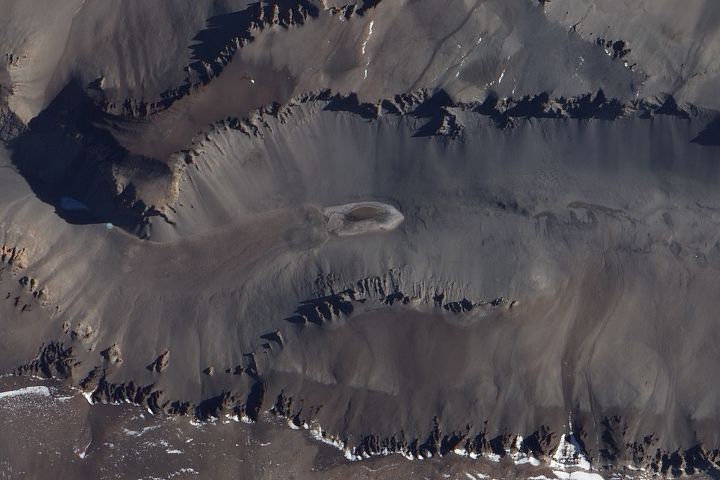
The scene depicts a valley in a cold climate, with some kind of body of water (or other liquid?) at center. The sinuous shape suggests glacial activity, though this conflicts with the lack of snow and ice. Notably, no vegetation is visible anywhere, making it look very similar to a HiRISE image of Mars. I then thought that this could be the McMurdo Dry Valleys in Antarctica. In college, I saw a number of presentations from professors and graduate students who had conducted research in the Dry Valleys because of the similarities to Martian climate. After only a few minutes of hunting around on Google Maps, I found the location. But what was in the center of the image that looked like a lake?

The Wikipedia page for the McMurdo Dry Valleys lists a number of lakes. I clicked on the link for Don Juan Pond, which was noted to be the most saline of all, and bingo: the image was a perfect match. I quickly wrote up a description and submitted it in the comments section. Lo and behold, I was the first commenter and won the puzzler!

As it turned out, the research paper that inspired the puzzler was coauthored by Brown researchers Jay Dickson and Jim Head. Perhaps it was the memory of one of their presentations that made me think of the Dry Valleys. Either way, what a small world.

Introduction to ArcPython lecture

For the third year running, I returned to Brown to give a guest lecture about using Python in GIS for GEOL1320: Introduction to Geographic Information Systems for Environmental Applications. I’ve used ArcPython extensively in my work at Cadmus, and it’s exciting and heartening to be invited to lecture to GIS novices about the topic.

Nonetheless, the lecture is a challenge. I don’t have any formal experience teaching undergraduates. Moreover, it’s practically impossible to teach a programming language (even one as intuitive as Python) in an 80 minute time slot, let alone its nuanced GIS applications. Thus my strategy has been to think of the lecture as an icebreaker: a way to take away the barriers and scare-factor associated with getting started with Python. After a brief introduction, I showcased a few real-world examples of how I’ve used ArcPython in my work. Then the whole class worked through a live demo, doing a fairly simple task—adding fields to a feature class—using progressively more complex Python commands. Eventually, we even packed the final tool into a Python custom toolbox connected to a separate .py script file.

This year was definitely the most successful yet. The fact that students typed the commands themselves in a lab-format class made for a more engaging and effective class versus students watching me type in a lecture-format class. I hope these GIS novices got a good sense of what is possible with ArcPython. My slides are attached below.

Download slides (1.8MB .pptx)

Senior Thesis – Drivers of land-use change in Mato Grosso: A ten-year MODIS analysis

Senior thesis - PDF download (13.2MB)
Senior thesis – PDF download (13.2MB)

As part of my Bachelor of Science in Environmental Science degree program, I am required to write a senior thesis. After taking GEOL133 in Spring 2010, I knew I was interested in exploring additional topics in remote sensing. My GEOL133 professor, Jack Mustard, got me involved in some of his research examining agricultural extensification and intensification in the central Brazilian state of Mato Grosso. After two semesters of downloading data, learning IDL, processing tiles, testing smoothing techniques, and creating figures, this was the result.

I want to thank my advisors, Jack Mustard, Leah VanWey, and Chris Neill for their invaluable help, guidance, and feedback. Additional thanks to Lynn Carlson, Gillian Galford, Xi Yang, Rebecca de Sa, Shelby Riskin, Marcio Caparroz, Peter Klein, and Brett Lien for their help and assistance.

Abstract

The Brazilian state of Mato Grosso represents a hotspot of large-scale anthropogenic land-use change with major implications for the global carbon cycle, biodiversity, and regional climatic processes. Previous research has documented both the expansion of croplands into the state’s rainforest and cerrado biomes and the intensification of existing croplands through the increased prevalence of multi-cropping. Less closely examined are the socioeconomic drivers of this agricultural growth. In this study, we use the latest version of 250 meter vegetation indices satellite data from Terra-MODIS and a phenology classification algorithm to characterize cropland expansion and multi-cropping intensification in Mato Grosso on a yearly basis from August 2000 through August 2010. We compared these land-use changes to variations in commodity prices, exchange rates, export destinations, and other relevant events. We observed a 25,095 km2 increase in the total area of cropland, while the percentage of cropland classified as multi-cropped grew from 37.6% to 64.4%. These changes correlated most closely to the exchange rate of the Brazilian real to the currencies of its primary soybean export destinations (Europe and China). Significant appreciation of the real since 2009 would suggest decreased cropland expansion and multi-cropping intensification going forward. However, recent rises in commodity prices and sweeping changes proposed to Brazil’s Forest Code may encourage continued or increased land-use change in the near future.