 Dan Mahr
This was my final paper for GEOL1330: Global Environmental Remote Sensing, where I used ASTER thermal infrared data to quantify the urban heat island of Providence, RI.
Providence’s Urban Heat Island: An Analysis with ASTER and Thermal Truthing
Abstract
Understanding the urban heat island is critical for public health officials, urban planners and policymakers as they shape the future of cities. In this study, thermal infrared ASTER data is used to characterize the nature of the urban heat island in Providence, Rhode Island and how it relates to vegetation coverage. Temperatures in the downtown area on a 22°C August night are found to be approximately 2°C warmer than nearby suburban areas, and 3°C warmer than the closest rural areas. Temperatures are found to be inversely correlated with vegetation coverage as calculated using NDVI. Historical air temperatures are used to ground-truth the thermal data. These values are within the 1.5°C range of precision for the advanced AST_08 product, which takes surface emissivity into account, in eight of ten scenes. The AST_04 product, which does not take surface emissivity into account, severely underestimated air temperature in all cases.
Overview
This project is part of a three-pronged analysis of Providence’s urban heat island with Devon Cupery and Wumeng He. Wumeng analyzed changes in vegetation using NDVI and Landsat 5 TM data. Devon compared Wumeng’s vegetation cover to daytime temperatures from Landsat 5 TM data. I am comparing Wumeng’s vegetation cover to nighttime temperatures from ASTER data. Devon and I are also comparing our temperatures to historical temperatures from the NCDC.
Background
Over half of the 6.9 billion people on the planet live in cities. One of the side-effects of such enormous urban areas is the urban heat island—a phenomenon where urban areas are significantly warmer than surrounding suburban and rural areas. Three main factors contribute to the heat island in cities: less vegetation, thermodynamic properties of buildings, and urban geometry.
For the purposes of this analysis, one can assume that the amount and spectral characteristics of incoming solar radiation are identical for urban and rural areas, i.e. weather and geography are negligible. In rural areas, much of this solar radiation is absorbed by plants. During photosynthesis, plants convert electromagnetic energy into chemical energy in the form of covalent bonds. Some of the electromagnetic energy is converted into thermal energy (i.e. heat). In urban areas, much of the of the surface area exposed to sunlight is concrete, asphalt and steel instead of vegetation. As a result, much more electromagnetic energy is converted into thermal energy (and not chemical energy) which increases surface temperatures. Providence’s heat island could be especially strong due to the city’s nighttime parking ban. Since no vehicles are allowed on the street at night, many property owners pave their front and/or back yards to allow for cars, further reducing vegetation cover.
Water, which has a very high heat capacity due to its intermolecular hydrogen bonds, converts electromagnetic energy into thermal energy, often evaporating in the process. Mammals take advantage of this chemistry in using sweat to thermoregulate. Although urban materials like asphalt and steel also have high heat capacities, they are unable to evaporate. As a result, they retain heat for long stretches of time without any direct process to transport heat away.
Urban geometry also increases temperatures. The canyon-like architecture of many downtown areas cause greater scattering and reduce the likelihood that radiation will reflect back into space. This lowers the effective albedo of cities, increasing absorbance and therefore temperatures. Furthermore, these urban canyons make it harder for heat to effectively radiate out at night, reducing the amount of cooling that can occur between sunset and sunrise.
The net effect of these three factors are city temperatures generally 1-5°C warmer than rural temperatures. This additional warmth incurs a number of side effects. During heat waves, the lack of relief from scorching temperatures causes hundreds of deaths every year in the United States, “more than hurricanes, lightning, tornadoes, floods, and earthquakes combined.” Energy usage also increases with temperature. For every 0.55°C (1.0°F) of additional summertime heating degrees, electricity usage increases 1.5 to 2.0 percent. Additional electricity generation from fossil fuel sources worsens air quality and emits more greenhouse gases. The takeaway from these side effects is that mitigating the urban heat island is a priority for public health officials, urban planners and policymakers.
The best proven strategy for mitigating the urban heat island is increasing the coverage of vegetation. A greater number of trees lining streets, more parks, thicker forests and an overall larger coverage of well-watered vegetation diminish the warming potential. However, such planting strategies take time and considerable funding to implement. The Forestry Division in Providence’s Department of Parks has made an effort recently to plant or replant street trees, partially for this reason.
Remote sensing is useful in analyzing the urban heat island. The coverage of vegetation can be inferred from visible and near-infrared reflectance, while temperatures can be inferred from thermal infrared radiation. These data help us answer critical questions:
- What is the nature of Providence’s urban heat island?
- How does this relate to Providence’s vegetation?
- How reliable are satellite data at inferring air temperature?
Data & Methods
Three main data sources are needed for this project: vegetation, surface temperature, and air temperature. In brief, Landsat 5 TM data were used for vegetation, ASTER data were used for temperature, and NCDC data were used for air temperature.
Vegetation
Vegetation cover and intensity for Providence can be determined using the Normalized Difference Vegetation Index (NDVI). The chlorophyll in green photosynthetic plants preferentially reflects electromagnetic radiation at near-infrared wavelengths—an effect known as the red edge. Knowing this, one would assume the only bands needed to map chlorophyll concentrations are in the near-infrared. However, this does not take into account shadows, terrain features, or linear perspective. These factors incur artifacts in the measurement of even a homogenously vegetated area. The NDVI normalizes these values with reflectance from a separate band to correct for these anomalies. The end result is a proven description of vegetative intensity.
Data from Landsat 5’s Thematic Mapper (TM) sensor were used to calculate NDVI. Seven cloud-free scenes from 1995 to 2009 were used. After atmospheric calibration and dark subtraction, the NDVI was calculated by Wumeng.
Surface Temperature
Thermal data was acquired from Landsat 5’s Thematic Mapper (TM) and Terra’s Advanced Spaceborne Thermal Emission and Reflection Radiometer (ASTER). These two sensors have strengths and weaknesses (see right). While Landsat has larger swaths, more complete coverage, and is available from the easier-to-use GLOVIS repository, ASTER has more thermal bands, better spatial resolution, higher-bit quantization, and collects more imagery at night. We decided to utilize both data sources. Devon focused on the Landsat thermal imagery for daytime scenes, while I focused on ASTER for nighttime scenes.
| Landsat TM | ASTER | |
| # Thermal IR Bands | 1 | 5 |
| Spatial Resolution | 120m | 90m |
| Swath | 185km | 60km |
| EST/EDT Capture Times | 10:30/11:30 | 10:00/11:00, 22:00/23:00 |
| Quantization | 8 bits | 12 bits |
| Coverage | Complete | On-demand |
| Repository | GLOVIS | WIST |
Unlike visible and near infrared bands where sunlight is reflected off of the surface and into the sensor, thermal infrared radiation comes from the surface’s blackbody radiation. Planck’s Law states that the wavelength where a blackbody’s radiance peaks depends precisely on its temperature. Thus, one can work backwards from radiance using an inverted form of Planck’s Law to determine the surface temperature.
Landsat TM collects longwave thermal infrared radiation in one band from 10.40-12.50 microns. The first step in calculating temperatures is to convert the raw digital numbers into radiance using a published formula and a set of scene-specific constants. Then, using the modified version of Planck’s Law, radiance can be converted into temperature using other sensor-specific calibration constants and knowing the central wavelength of Band 6.
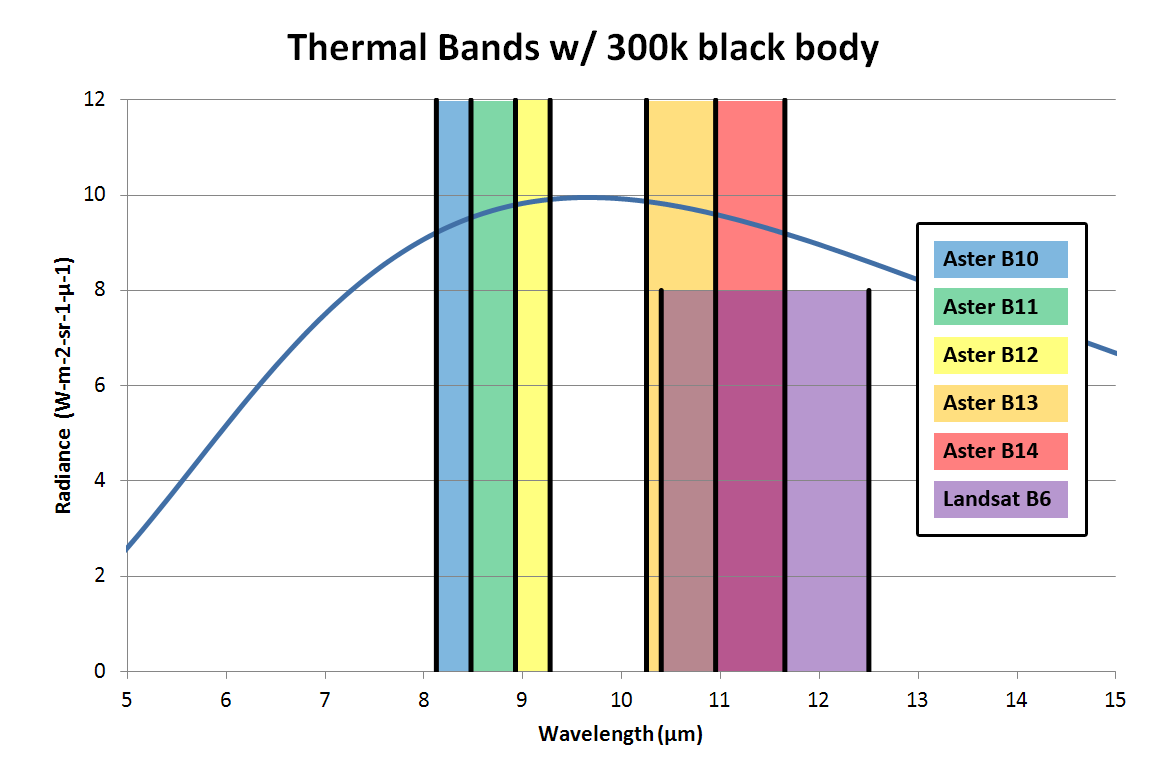
ASTER collects thermal infrared radiation in five discrete bands (see right). Three of these bands are between 8.125 and 9.275 microns, with two more between 10.250 and 11.650 microns. They are split due to an ozone absorption band. The radiance from each of the five thermal bands can be processed in a similar workflow as Landsat to determine temperature. This was done manually using a similar inverse Planck’s Law with different sensor-specific constants. In addition, another product is directly available from the WIST repository. JPL (Jet Propulsion Laboratory) created a lookup table for each ASTER band containing “values that represent observed radiance as a function of brightness temperature” based on the sensor’s specifications. This table was inverted so that temperature is represented as a function of radiance. When temperature needs to be calculated, one simply looks up the radiance value. JPL claims that this method is more precise because the inversion of Planck’s Law “becomes increasingly inaccurate for temperatures farther away from [the sensor’s] standard temperature.” The lookup and processing is done on-demand by LP-DAAC (Land Processes Distribution Active Archive Center, ASTER’s data repository) to output temperatures for each band in product known as AST_04. AST_04 and the manually computed temperature were compared as a quality assurance check.
Both the manual temperature calculation and AST_04 incorporate a significant assumption: emissivity. The earth’s surface is not a perfect blackbody. Instead, it emits only a portion of the radiation that a blackbody of the same thermodynamic temperature would emit due to the chemical properties of that material. Therefore, the Planck inversions described above used an underestimated value for radiance, thus their temperature estimation is colder than in reality. Fortunately, an advanced ASTER product exists that takes emissivity into account when calculating temperature.
The increased spectral resolution provided by having five thermal bands allows for an improved estimate of surface temperature through temperature-emissivity separation (TES). Instead of assuming that the emissivity of the surface was always 1.0 (i.e. a perfect black body), TES approximates emissivity using the Normalized Emissivity Method and the Alpha Residual method, recovering temperatures within ± 1.5°K and emissivities within ±0.015. This advanced processing is also done on-demand by LP-DAAC and outputs temperatures in a product known as AST_08. This product was compared to AST_04 to see how much emissivity affects the final temperature value.
In all, ten ASTER scenes were chosen. The data were collected at 23:00 EDT during the months of May to September on cloud-free nights. For each scene, eleven temperature products were created: five bands of manually calculated temperatures using Planck’s Law, five bands of AST_04 temperatures calculated from the lookup table, and one band of temperatures calculated using the TES algorithm. It should be noted that in these scenes it is difficult to distinguish some types of cloud cover (especially low-level fog) because there are no visible or near-infrared bands in nighttime imagery to use as quality assurance checks.
The focus of this project is on land temperatures as opposed to water temperatures. In order to reduce the amount of noise due to anomalous surface temperatures of lakes, ponds, and Narragansett Bay, these regions were subtracted out of the final thermal data. Using hydrographic shapefiles from RIGIS and the Extract by Mask function in spatial analyst in ArcMap 9.3, any pixels that overlaid a water body were set to “NoData.” All reported statistics incorporated this subtraction process.
Air Temperature
To public health officials, urban planners and policymakers, the metric for measuring the strength of the urban heat island is air temperature. Since thermal infrared remote sensing detects surface temperature, a critical step in analyzing such data is ground-truthing these values based on historical air temperatures. This ensures that the remotely sense data depict air temperatures within accurately.
Thedore Francis Green State Airport is located approximately 7 miles south of downtown Providence. Located between two runways is National Weather Service station WBAN# 14765. This is a great source of air temperature data because ASTER’s thermal infrared instantaneous field of view is significantly smaller than the large (700m by 500m) homogenously vegetated field in which the station is located, ensuring that there is no interference of observed radiance due to other structures or features. The National Climatic Data Center (NCDC) data product DS3505 (Integrated Surface Hourly) has temperature, dew point, wind speed, wind direction, cloud cover, barometric pressure, and precipitation recorded every hour from this station since June 1, 1932. The air temperature closest in time to Terra’s flyover was used in the comparison. By happenstance, the hourly air temperature readings were all taken within 15 minutes of the data capture time.
Discussion
AST_04 Temperatures vs. Manual Temperatures
The temperature values for each band calculated on-demand using JPL’s lookup table were extremely similar to temperature values calculated manually using Planck’s Law and the L1B radiance data (see Figure 1). The average difference in temperature between the two values was 0.05°C. Since they agreed so closely, the AST_04 data are used henceforth to represent temperatures determined only using Planck’s Law.
AST_04 Temperatures vs. AST_08 Temperatures
The AST_08 data (Figure 2) were expected to be warmer than AST_04 because the TES algorithm factors emissivity into the calculation, which would result in a greater radiance and therefore a warmer temperature. This was found to be true across the board: AST_08 temperatures were 3.71°C warmer on average (see Figure 1). However, these differences were not evenly distributed. The average differences between AST_08 and AST_04 Bands 10-14 were 5.30°C, 4.52°, 4.01°, 2.24°, and 2.46° respectively. This is likely due to the wavelength of the peak of the blackbody curve being closest to the center wavelength of Band 13 (which had the lowest average delta-T) and farthest from the center wavelength of Band 10 (which had the highest average delta-T). Since the Planck function calculates temperature based on this central wavelength value, being farther displaced from it leads to distorted results. In an ideal world, additional sensors would collect data in the gap between Bands 12 and 13 since the blackbody radiation curve peaks there for most surface temperatures. However, the ozone absorption band in that region of the electromagnetic spectrum precludes this possibility.
The large delta-T values between AST_04 and AST_08 data potentially discredit the Landsat temperature data, which are processed similarly to AST_04. Curiously, Devon’s Landsat results do not show such large differences between surface temperatures and the NCDC air temperatures. This could be due to chance, or to Landsat’s wider thermal band, or to a better formula for converting radiance into temperatures. More investigation on this topic is needed before any conclusions can be drawn regarding the differences between the delta-T values of AST_04 and Landsat Band 6 as compared to air temperatures.
The scatter plot (Figure 3) between AST_08 and Band 13 AST_04 for 8/20/2003 shows a roughly linear distribution that is offset from the baseline. This suggests that by factoring in emissivity, AST_08 inferred a temperature approximately 1.5-2.5°C warmer than the best AST_04 temperature. Interestingly, the offset increases with temperature. Assuming most of the difference in temperatures is due to the consideration of emissivity by the TES algorithm in AST_08, this suggests that in this scene warmer surfaces correlate with lower emissivities and therefore higher AST_08 temperatures. I hypothesized that this was due to warmer urban areas potentially having more low-emissivity surfaces like steel, glass, and white-painted structures. To test this, I divided the scatter plot into three general regions and selected them individually using the region of interest tool. The high delta-T low-emissivity region in the top right of the point cloud corresponded to the downtown urban area and surface water; the mid delta-T mid-emissivity region in the middle corresponded to suburban areas; and the low delta-T high emissivity region in the lower left corresponded to rural areas. The takeaway of this analysis is that AST_08 ostensibly has the greatest impact in improving the accuracy of temperature values over AST_04 in areas with lower emissivities like urban centers.
NCDC Air Temperatures vs. AST_08 Temperatuers vs. AST_04 Temperatures at T.F. Green
The air temperatures recorded at the weather station were remarkably close to the AST_08 temperatures (see Figure 1). The difference between the two values was within the 1.5°C range of precision in eight out of ten scenes. This impressive similarity gives credence to the use of the AST_08 product in inferring air temperatures for use in delineating the extent of the urban heat island.
In the two scenes where the differences were greater than 1.5°C, AST_08 inferred a much colder (approximately 4.5°C) temperature than the recorded air temperature. This deviation is not likely the result of error in the air temperature data, since the temporally adjacent data points were very similar. Therefore, the error likely lies with the AST_08 data, for which there are a number possible explanations. High-altitude clouds or haze could have intersected the field of view, though this is not supported by cloud cover data from the weather station. It is not possible to check for clouds using the visible or infrared ASTER bands because the scene was captured at night. Dew could have formed on the grassy field, though this is not supported by dew point/humidity data from the weather station (those two scenes were in fact particularly dry with dew points of 10.0°C and 10.6°C). The TES could have used an inappropriately high value for the emissivity of that region, resulting in an inappropriately cold temperature. A combination of any of these factors could have produced the temperature anomalies. For the purposes of informing public health officials, urban planners and policymakers, these scenes would likely be flagged as not meeting data quality standards and subsequently dropped from further analysis. In the future, it would be useful to have ground-truthed air temperature readings from a multitude of points to determine whether such anomalies are pixel-specific, regional, or cover the entire scene.
AST_08 Temperatures vs. NDVI
Surface temperatures from 8/20/2003 (Figure 2) and NDVI from 7/26/2003 are compared in a scatter plot (Figure 4). These two scenes were compared because the ASTER scene was relatively warm and because of the temporal proximity to Landsat NDVI data. This comparison shows a shallow negative slope, meaning higher NDVI values generally correlate to lower temperatures. This agrees with the hypothesis that vegetation leads to cooler temperatures. The large coverage of forest in the scene is represented by the concentration of points with an NDVI of approximately 0.9 and temperatures between 20°C and 23°C. Most points with an NDVI of less than 0.5 had slightly warmer temperatures, generally between 22°C and 25°C.
AST_08 Temperatures in Urban, Suburban and Rural ROIs
Three large, representative regions of interest (ROIs) were created in areas with varying levels of urbanization (see Figure 2). The urban ROI is located in downtown Providence; the suburban ROI is located between Barrington, RI and Riverside, RI; the rural ROI is located near East Greenwich, RI. In the 8/20/2003 ASTER scene, the mean temperatures in the urban, suburban and rural ROIs were 24.32°C, 22.71°C, and 21.36°C respectively. This quick approximation suggests that the downtown area is generally 2°C warmer than the suburbs, and 3°C warmer than rural areas. These temperature differences agree with those found in the 8/20/2003 AST_08 vs. NDVI analysis above.
Conclusions
Based on AST_08 data, downtown Providence is 2°C warmer than suburbs and 3°C warmer than rural areas. These differences in temperatures correlate very closely with differences in vegetation cover. This suggests that increasing vegetation will likely moderate temperatures on warm nights, keeping the air temperature lower. Public health officials, urban planners and policymakers should take this into account as they work to combat the effects of the urban heat island.
Unfortunately, no ASTER scenes of Providence are available during heat waves when air temperatures exceeded 32°C (90°F). If and when such data do become available, it would be prudent to run similar analyses to determine if the extent and magnitude of the heat island is different during heat waves.
The AST_08 data product inferred temperatures remarkably close to air temperatures recorded at the T.F. Green weather station for eight of ten scenes. Further study is needed to determine why the other two scenes had significantly cooler temperatures. In addition, an inquiry into the differences between the inverse Planck’s Law functions used for ASTER and Landsat is needed to determine why the delta-T values in ASTER are so much higher than the delta-T values in Landsat.
References
- Alley, Ronald E., and Marit Jentoft-Nilsen. “Algorithm Theoretical Basis Document for Brightness Temperature, Version 3.1.” Jet Propulsion Laboratory, July 23, 2001. http://eospso.gsfc.nasa.gov/eos_homepage/for_scientists/atbd/docs/ASTER/BTS_ATBD.pdf.
- Gillespie, A., S. Rokugawa, T. Matsunaga, J.S. Cothern, S. Hook, and A.B. Kahle. “Temperature/Emissivity Separation Algorithm Theoretical Basis Document, Version 2.4.” NASA, March 22, 1999. http://eospso.gsfc.nasa.gov/eos_homepage/for_scientists/atbd/docs/ASTER/atbd-ast-05-08.pdf.
- Jensen, John R. Remote Sensing of the Environment: An Earth Resource Perspective. 2nd ed. Prentice Hall, 2006.
- NASA. “Data Products,” June 23, 2009. http://landsathandbook.gsfc.nasa.gov/handbook/handbook_htmls/chapter11/chapter11.html.
- NASA. “The Landsat Program – Technical Details,” 2009. http://landsat.gsfc.nasa.gov/about/tm.html.
- NCDC. “NCDC: Weather Station 14765,” 2010. http://www.ncdc.noaa.gov/oa/climate/stationlocator.html.
- NCDC. “Surface Hourly Abbreviated Format,” April 11, 2005. http://cdo.ncdc.noaa.gov/cdo/3505doc.txt.
- United Nations. “World Urbanization Prospects, the 2009 Revision.” Department of Economic and Social Affairs, Population Division, 2010. http://esa.un.org/unpd/wup/doc_press-release.htm.
- URI EDC. “Rhode Island Geographic Information System Data — RIGIS Data,” n.d. http://www.edc.uri.edu/rigis/data/all.aspx.
- US CDC. “CDC Extreme Heat | A Prevention Guide to Promote Your Personal Health and Safety,” 2009. http://www.bt.cdc.gov/disasters/extremeheat/heat_guide.asp.
- US EPA. “Reducing Urban Heat Islands: Compendium of Strategies – Urban Heat Island Basics,” 2008. http://www.epa.gov/hiri/resources/pdf/BasicsCompendium.pdf.